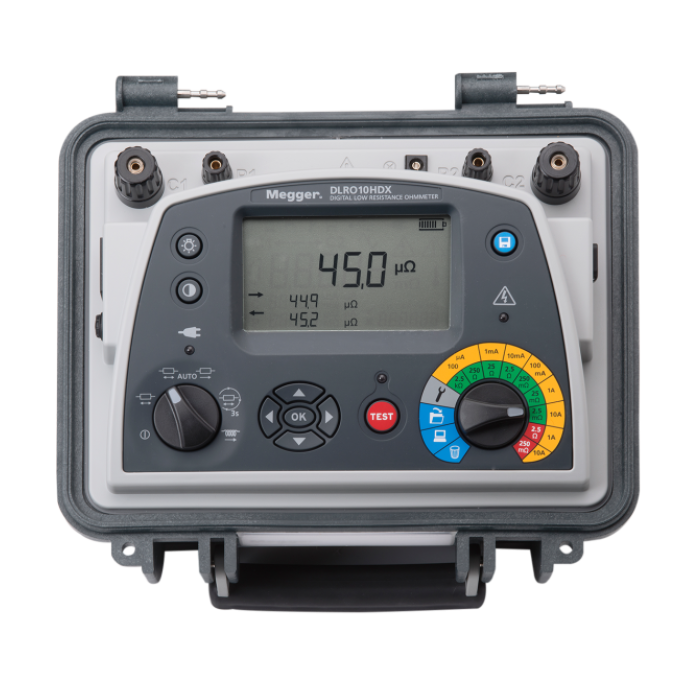
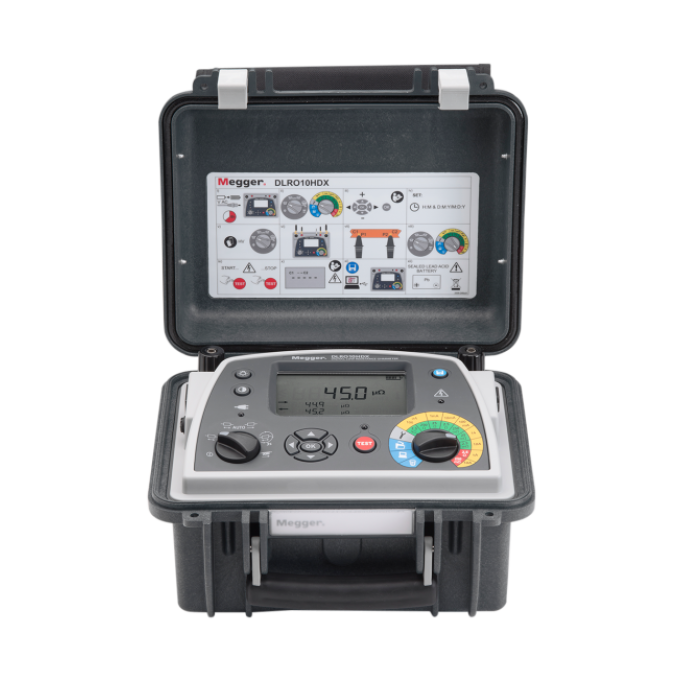
DLRO10HD and DLRO10HDX digital low resistance ohmmeters
About the product
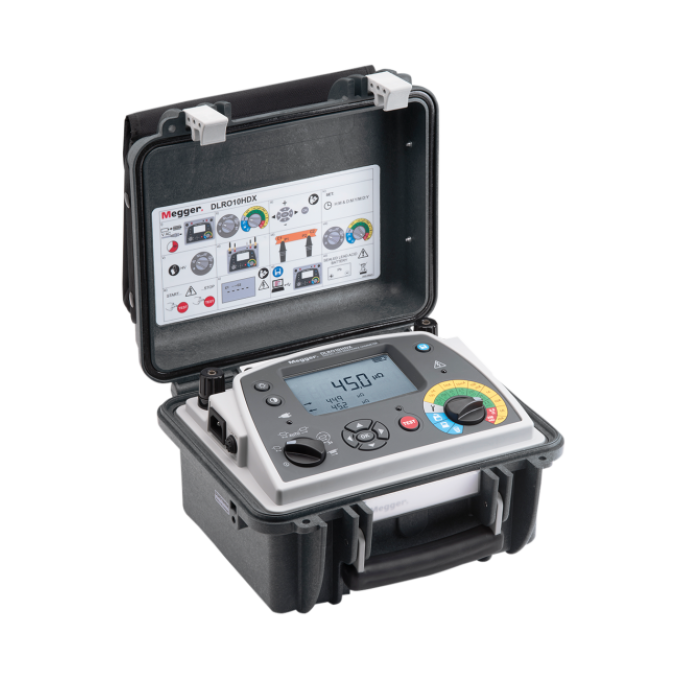
The heavy duty DLRO10HD and DLRO10HDX digital low resistance ohmmeters can deliver a 10 A current into circuits up to 250 mΩ and 1 A into circuits up to 2.5 Ω. The duration of each test can be up to 60 seconds, reducing the time required for cooling. These units have a high and low output power selection for condition diagnosis.
The DLRO10HD and DLRO10HDX instruments can be powered from their own sealed, rechargeable lead-acid battery or via mains power. This makes them suitable for continuous testing in repetitive use environments, such as production lines. Additionally, they come in a rugged case designed for stable ground and bench operation. They are IP54 rated when operational and IP65 when the lid is closed, which is ideal for working in all weather conditions.
Both units have five test modes: bidirectional (whereby current reversal with averaging cancels thermal EMFs), unidirectional, automatic, continuous, and inductive. You select the desired mode through a simple rotary control on the mode selection rotary switch. These rotary switches are easy to operate, even with gloved hands, and the instruments’ large, clear, backlit LCD makes for easy reading even from a distance.
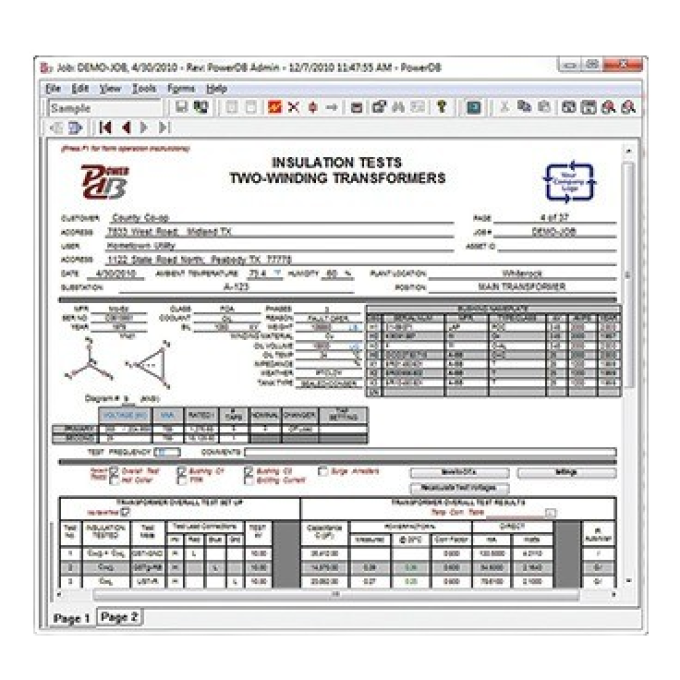
The DLRO10HDX has some additional abilities over the DLRO10HD. It is rated CAT III 300 V (as long as the optional terminal cover is fitted to the instrument) and comes with onboard memory storage for up to 200 test results. The memory functions: ‘delete’, ‘download to PowerDB’, and ‘recalling test results’ are also accessible via the range selection rotary switch on this model.
Additional videos